GRAPHS ON THE GO : Adding or subtracting constant in function.
Hope you all have gone through the basic graphs.


In this post we will modify those graphs.
Let's begin............
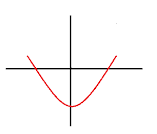
Let's take a graph say y = x^2.
Now if we add 2 in it which means if we change the function to y = x^2 + 2
Then, the resultant graph looks like the second graph.


actually what happened is the original graph adds 2 to its each value.
For example it was giving y=4 at x=2
But now it gives y=4+2=6 at x=2
Similarly if we would have taken y = x^2 -2
Then the graph would have decreased 2 from each value of y..
Example- for x=2 it gave y=4 originally
but now for x= 2 it will give y= 4-2=2.
The resultant graph will look like-


Similarly some other examples where constants are added or subtracted in a particular function are as follows- (where k>0 and k belongs to Real numbers)


Stay Tuned for the next post.
For any query comment down there.


Comments
Post a Comment