GRAPHS ON THE GO: MOD effect -1
In this we will learn about effect when it is applied to x.
Let's begin-
Firstly we need to know about how modulus function works.
Simply it return the positive value of number number inside it.
it is mathematically defined as-
Also it evident by the graph y = | x |
If we observe carefully its gives same values for x = 2 and x = -2, hence its implies that for every input for x it result out a positive number out of it.
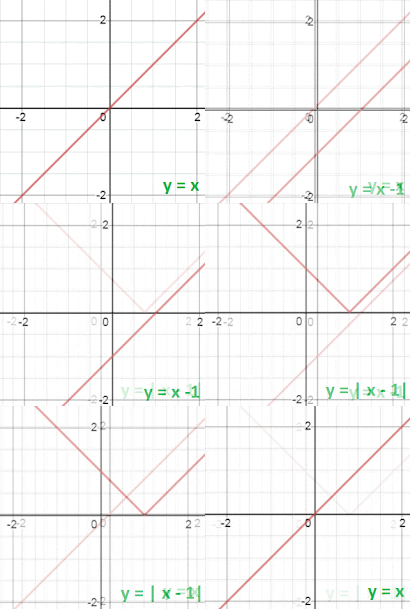
Now if we take y = x line then it is -
and if we apply modulus function to x in it then the resultant function comes out to y = | x |.
In according this for each input inside it the output which equal to y here should be positive and if we consider the mathematical definition of modulus function it results out with.
two parts of this graph which would be y = x for x>=0 and y = -x for x<0.
Combining all these conditions we get -
We can say that the part which gave negative value of y changed to giving positive value of x which can be visualised by the animation above.
Basically making it simple applying mod to x only makes the mirror image of part of graph below x axis about y axis, as y can never be negative when it is equal to a function on which mod is applied.
Lets consider a graph say y = x^2 - 1
and lets see how the y = |x^2 - 1|
In this case also y can never be negative as it is equal to an expression on which modulus is applied.
So in this case also we will take the mirror image about y axis.
Now to draw the graph of y = x^2 - 1, we will use the concept learned in previous posts.
Steps we will follow are-
1. Draw y = x^2
2. Using 1 draw y = x^2 -1
3. And now using this draw y = | x^2 - 1 |
this goes on as follows
Some more examples for the same-
Stay Tuned for the next post.
For any query comment down there.


Comments
Post a Comment